Introduction
Simple Network Management Protocol (SNMP) is an internet standard protocol that allows information exchange between managed devices. SNMP primarily supports network device monitoring and detects issues according to the data from the device. The network devices include in-built SNMP agents to enable and configure the communication with the Network Management System (NMS).
In a network, the system or the server running the monitoring software is the managing entity and the device that requires monitoring is the managed device. All SNMP messages traverse between:
- SNMP agent (in the managing entity)
- SNMP manager (in the managed device)
OpsRamp supports the following methods for SNMP monitoring:
Passive monitoring: Ingest SNMP Traps into the platform using alerts. For more information, see SNMP Traps.
Active Monitoring: Discover the target devices in the platform and monitor using templates. For more information, see SNMP Monitoring.
SNMP-managed device components
Types of SNMP-managed device components are:
SNMP Manager (Network Management System)
A software platform that can collect information stored by the agent. The SNMP manager processes the collected information in a readable format (tables and graphs) to the network administrator. The NMS polls the agent for the required details of a given device in the form of alerts, reports, and graphs.
SNMP Agent
A software that is pre-installed in the network device that gathers metric details such as disk space. The network device uses the SNMP Agent to update the metric information in the Management Information Base (MIB).
Managed device
The device that requires monitoring is the managed device containing a managed agent. The commonly available managed devices are Routers, Switches, Firewall, and Load Balancer.
Management Information Base
The Management Information Base (MIB) stores the monitoring details of the managed device hierarchically. Each device contains different attributes or objects to monitor and unique object identifiers (OIDs).
Object identifier (OID)
OIDs are unique identifiers to classify objects defined in MIB files for each managed device. For example: sysUpTime (1.3.6.1.2.1.1.3.0).
Types of OIDs are:
- Scalar object: A single instance in a managed device.
- Tabular/Columnar object: Multiple instances in a managed device.
The administrators can easily retrieve object details using OIDs from the MIBs stored on the SNMP agent.
Scalar object instances
Scalar objects contain only a single instance with a 0 sub-identifier appended to the object identifier. For example, sysUpTime (1.3.6.1.2.1.1.3.0) indicates the time (in hundredths of a second) when the network management portion of the system was last re-initialized.
Tabular object instances
Tabular or Columnar objects contain multiple instances in a managed device. These instances are identified using a sequence of sub-identifiers appended to the object identifier. For example, ifOperStatus(1.3.6.1.2.1.2.2.1.8) indicates the current operational state of the interface.
SNMP message types
SNMP messages are sent and received between the SNMP manager and agent using Pull (Poll) and Push technology. The SNMP manager initiates the communication, and the agent forwards the response using the Transmission Control Protocol/Internet Protocol (TCP/IP) or User Datagram Protocol (UDP).
Types of SNMP messages available for SNMP monitoring are:
- GETRequest
- RESPONSE
- GETNEXTRequest
- GETBULKRequest
- SETRequest
- TRAP
- INFORMRequest
Supported resources
OpsRamp supports SNMP monitoring for all device types that are SNMP-enabled supporting SNMP V1, V2, and V3 protocols. For example, Network Devices, Storage Devices, Server Hardware, Applications, and VOIP Applications.
To view the detailed list of device types discovered using OpsRamp, go to Setup > Resources > SNMP Resource Type Definitions.
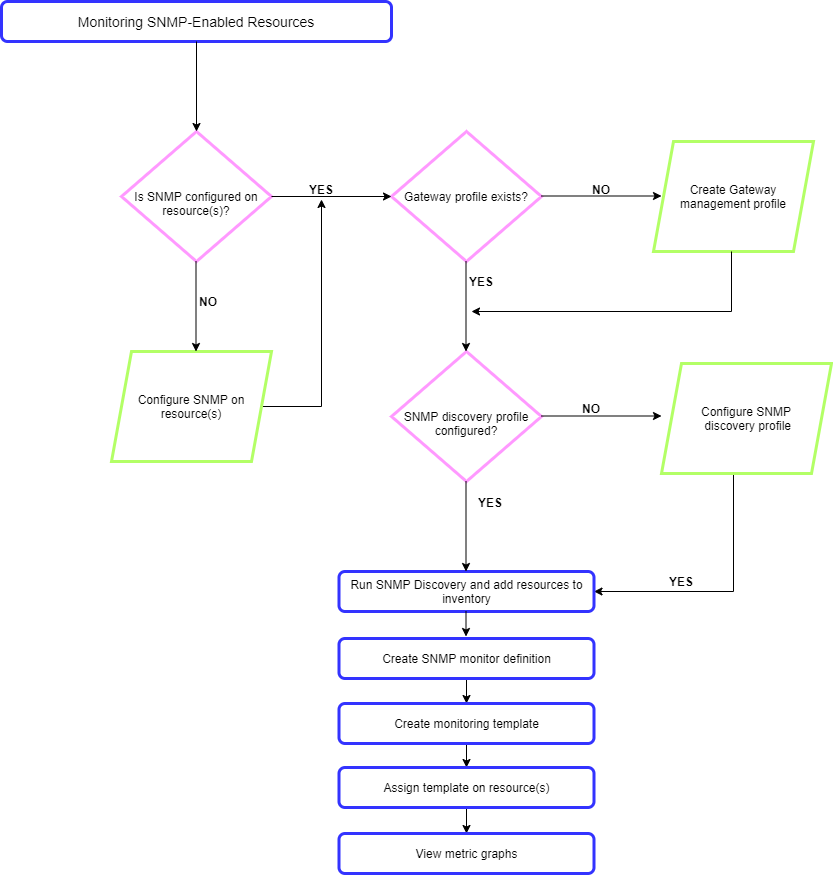
SNMP monitoring process

SNMP Monitoring Flowchart
Scenario
System Uptime Monitoring
Problem: Tim Tools, an administrator wants to assign a monitor that verifies the number of days since the SNMP-enabled resources like network devices and servers are up and running.
Solution: Tim can use the System Uptime monitor to verify the number of days and time since the resources are up and running. When the system reboots, the monitor replaces the existing uptime value with zero.
CISCO Memory
Problem: Tim Tools wants to monitor the memory performance of the applications on the managed device and receive alerts if the system performance degrades due to increased memory utilization.
Solution: Tim can use the Cisco Memory monitor to check the memory utilization of the applications on the managed device.
Visualization
Dashboard
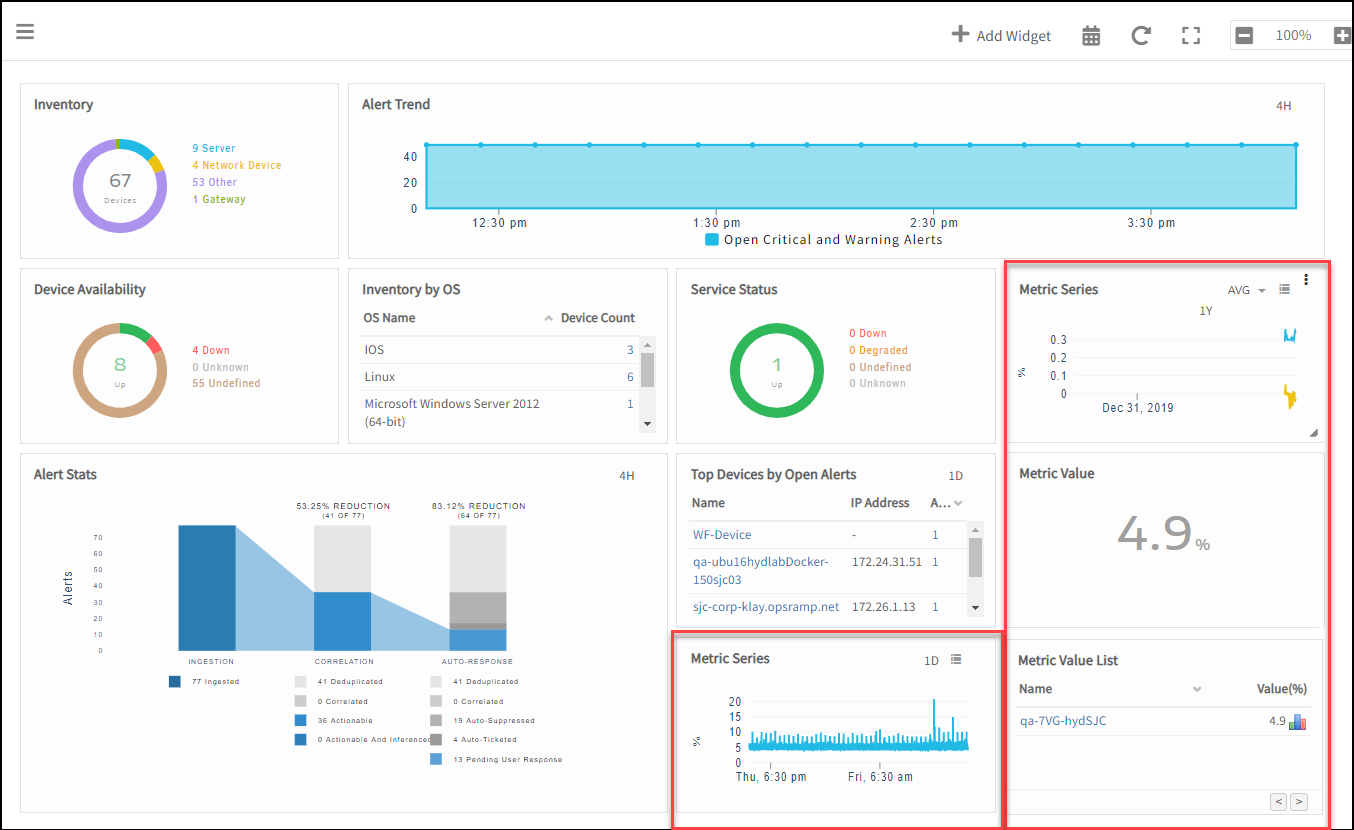
After initiating the SNMP monitoring, use Dashboard to gather customized visibility of the resources in your managed environment. Create widgets such as Metric Value, Time Series, Metric List, and Top Metric Utilization to track the performance of the resources.

Dashboard
Reports
The reports generated to view the SNMP data are as follows:
- Custom Metric report
- Standard Reports - Metric and Inventory reports
For more information, see Reports Overview.